A forecast is easy to mistake for a picture of the future. It arrives as a line on a chart, a number beside a rain cloud, a revenue target or a confident sentence about what a system will do next. The presentation is singular. The world is not.
A forecast is an estimate produced from a starting state, a model, assumptions and a horizon. It may be skillful, carefully calibrated and useful. It can still be wrong without being fraudulent, and right without proving that its reasoning was complete. The question is not whether a forecast possesses certainty. The question is whether it represents uncertainty honestly enough to improve a decision.
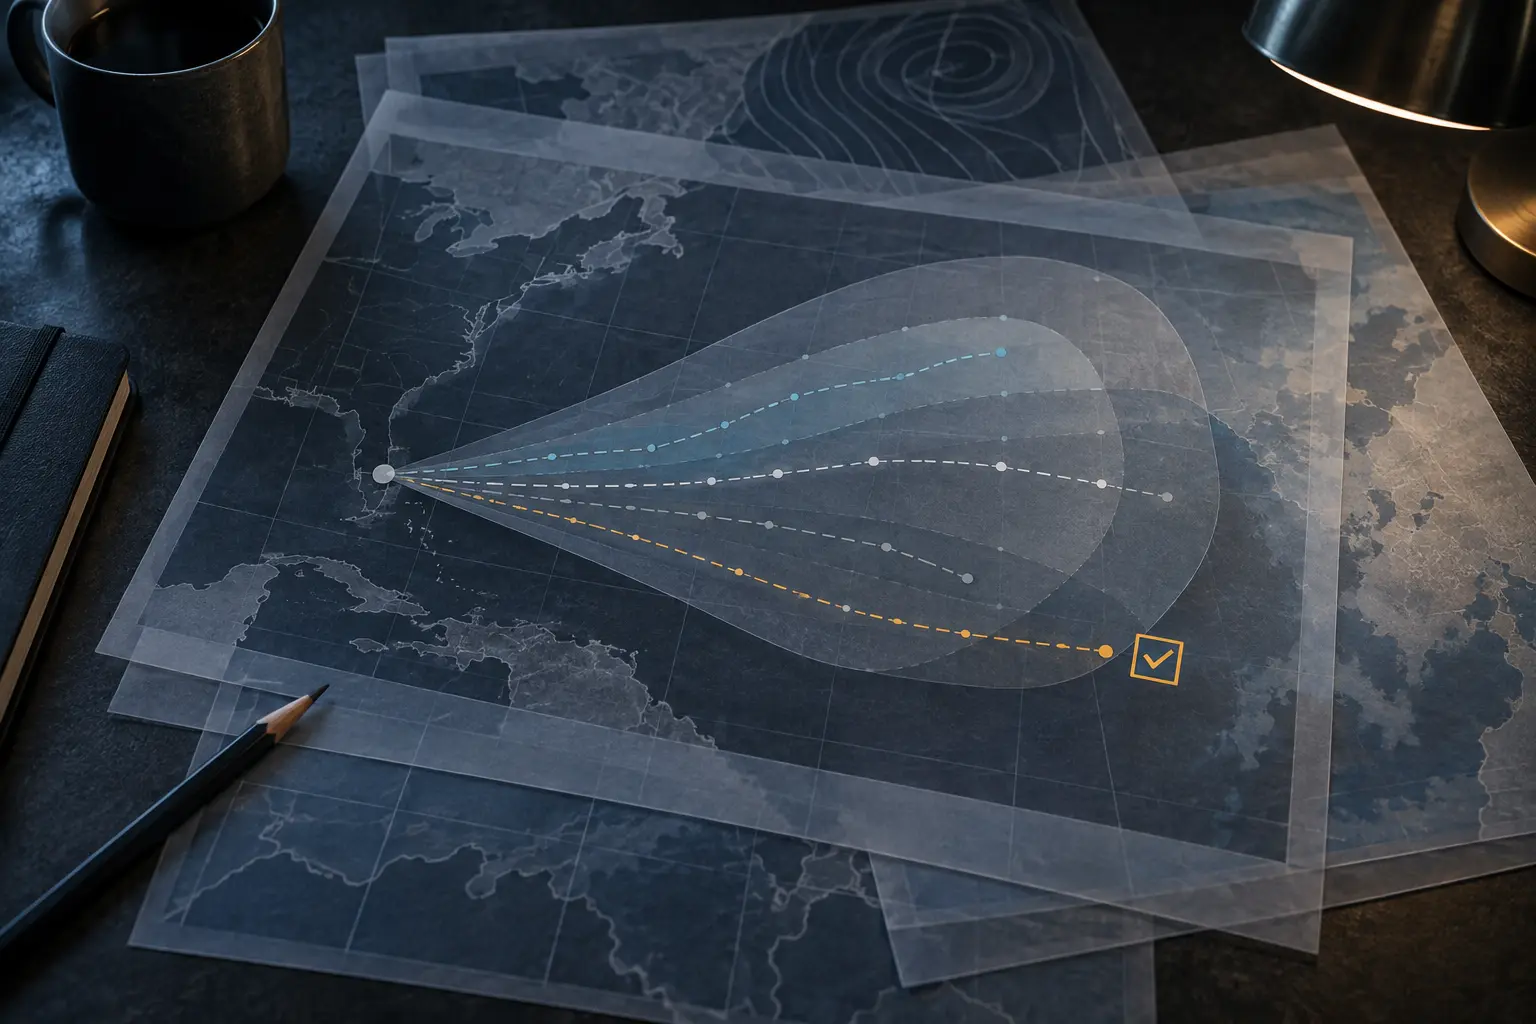
A forecast is a conditional statement
Every forecast has an implied structure: given the available observations, the selected model, its parameters and these assumptions, some outcomes are more plausible than others over a defined period. Remove the conditions and the result begins to sound like prophecy.
Weather makes the structure visible. Numerical models begin from an estimated atmospheric state. That state is incomplete, and the equations contain approximations. Small differences can grow as the model moves forward. The European Centre for Medium-Range Weather Forecasts therefore runs ensembles from perturbed initial conditions and model realizations. The spread is not decorative indecision. It is evidence about the range the system can presently resolve.
The same logic appears in budgets, demand plans, election models, maintenance predictions and AI outputs. Inputs may be noisy. Relationships may change. People may respond to the forecast itself. A projected sales number can alter hiring; a traffic estimate can change routes; a risk score can change who is inspected. The forecast can become part of the system it describes.
Why a point estimate feels stronger than it is
Organizations prefer one number because one number fits a plan. “Next quarter will be 8.2” appears actionable in a way that “a plausible range is 6.4 to 10.1, with asymmetric downside risk” does not. The precision reduces administrative friction while creating epistemic theater.
A point estimate can be the mean, median, mode, most likely scenario or simply the output chosen for display. Those are different objects. A mean may describe no likely individual outcome. A most likely value can still have a low absolute probability when possibilities are widely distributed. A range can hide tail risks if the boundary is chosen for convenience.
Do not discard the point estimate. Ask what it summarizes. A useful forecast package identifies the event, time horizon, central estimate, range, probability or confidence language, assumptions and update trigger. Without those fields, apparent precision often exceeds practical meaning.
Probability describes repeated judgment, not a promise
A 30 percent forecast does not become false every time the event fails to occur. It becomes suspect when events assigned 30 percent occur far more or less often than 30 percent across comparable cases. That property is calibration. It is assessed over a set of forecasts, not by celebrating or condemning one outcome.
The National Weather Service defines probability of precipitation for a specified period and point as the likelihood of measurable precipitation—at least 0.01 inch. It does not mean rain for 30 percent of the day, over exactly 30 percent of an area or with 30 percent intensity. The event definition matters as much as the probability.
This is why confidence is not calibration. A speaker can sound certain while making poorly calibrated forecasts. Another can communicate ranges awkwardly while producing reliable probabilities. Style and track record are different evidence.
Uncertainty usually changes with the horizon
Forecast lead time matters because errors have time to grow and because the system has more opportunities to change. ECMWF explains that uncertainty arises from both imperfect initial conditions and model approximations. Its medium-range ensembles are designed to show a range of possible conditions; wider spread generally indicates greater uncertainty.
Near-term observations can constrain a weather forecast tightly while later branches diverge. A cash forecast may be dependable through committed invoices and much weaker beyond unsigned contracts. An equipment-failure estimate may be useful within the population and operating conditions used to build it, then fail after a design change.
“The forecast changed” is therefore not automatically an admission that forecasting failed. A forecast should change when meaningful new evidence arrives. Refusing to update can be less scientific than revision. The honest comparison is between what could reasonably be known at each issue time, not between the newest estimate and an imaginary perfect prediction made earlier.
A projection is not always a prediction
Some future-facing results are conditional scenarios rather than estimates of what will probably happen. Climate projections, for example, explore outcomes under specified emissions and socioeconomic pathways. The IPCC distinguishes projections from deterministic weather forecasts because future forcing depends partly on choices that have not yet been made.
That does not make a projection meaningless. It changes the question. “What happens under this pathway?” is different from “Which pathway will society follow?” Collapsing them lets critics dismiss useful conditional analysis for failing to predict the condition itself.
Scenario work should keep the branching variable visible. If a retirement projection assumes contributions continue, the result is not a promise that they will. If an AI adoption model assumes stable labor demand, its output should not quietly become evidence for that assumption.
Score the right failure
A forecast can be accurate on average and useless for the decision. Temperature error may matter less than whether ice forms before a commute. A demand model may minimize average error while repeatedly missing rare shortages. Accuracy must be connected to the consequence and action threshold.
Before evaluating a forecast, write the decision it was meant to support. Then identify false-positive and false-negative costs. An evacuation warning, inventory order and weekend picnic do not need the same threshold. The forecast supplies evidence; the decision rule converts evidence into action.
This prevents hindsight from doing too much work. If a 20 percent event occurs, the forecast was not necessarily poor. If the downside was catastrophic and preparation cheap, ignoring 20 percent may still have been a bad decision. Outcome quality and decision quality are related but not identical.
Use the seven-question forecast audit
- What event is being forecast? Define the measurable outcome, location, population and time period.
- What is conditional? List assumptions, scenarios, planned actions and inputs that could change.
- What does the displayed number summarize? Identify whether it is a mean, median, mode, scenario or probability.
- How wide is the plausible range? Look for intervals, ensemble spread and tail cases, not only a center line.
- How has this forecaster performed on comparable cases? Prefer calibration and error records over confidence.
- What decision threshold matters? Match action to consequence, reversibility and preparation cost.
- What new evidence should trigger an update? Set the refresh condition before the result arrives.
The bottom line
A forecast is not a failed prophecy waiting to happen. It is a structured attempt to make uncertainty usable. Its strength comes from explicit conditions, defined events, measured performance and the willingness to update.
Demanding certainty encourages forecasters to hide the very information a decision needs. Treating every miss as incompetence encourages vague language that cannot be scored. A better standard is narrower: did the forecast state what it knew, preserve what it did not know and help choose an action suited to the stakes?
Research and interpretation notes
- NOAA National Centers for Environmental Information, Global Ensemble Forecast System, on using multiple forecasts to represent uncertainty.
- European Centre for Medium-Range Weather Forecasts, Quantifying forecast uncertainty, on initial-condition and model uncertainty.
- National Weather Service Albany, What Does Probability of Precipitation Mean?, for the official event definition.
- Intergovernmental Panel on Climate Change, Climate Change 2021, Chapter 4, for the role of projections and initialized predictions.
- For recording expectations before hindsight arrives, use the decision-journal protocol.
END OF TRANSMISSION 040
Keep the question. Test the model.
Choose the narrowest claim the evidence can carry, then leave room for revision.